There has been a steady growth of fatal highway crashes across the state of Utah. The National Highway Administration’s data shows that fatal crashes are happening more and more over the years. It’s becoming a major concern for highway safety.
How Many Fatal Car Accidents Were There in Salt Lake County?
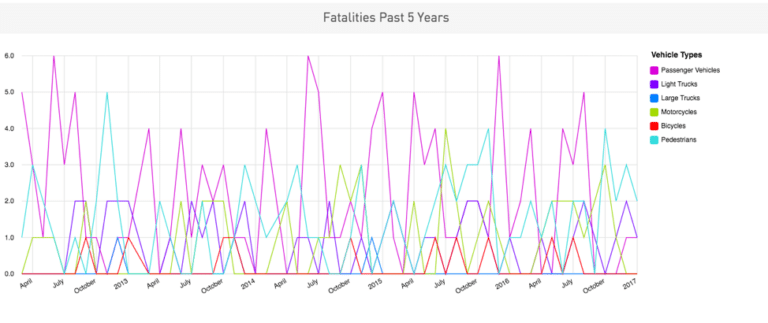
Salt Lake County faced 68 fatal crashes in total in 2020. The majority of these crashes involved pedestrians. If we look close at the line chart of types of vehicles involved in crashes, we see that over the past 5 years passenger vehicles and pedestrian accidents have been the most predominant in this county.
With our Utah FARs dashboard, we were able to examine Utah’s most populated county and find out which types of vehicles were involved in deadly accidents.
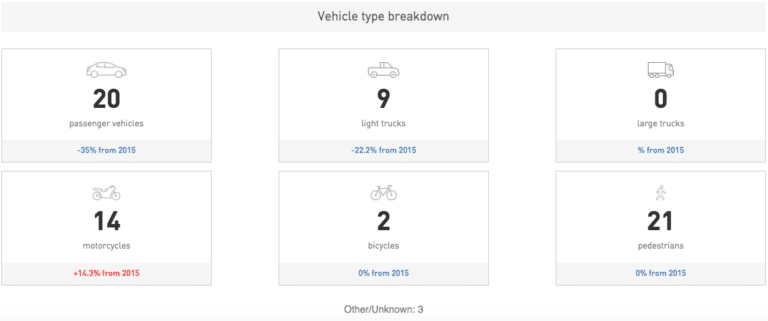
Our table below that references the line chart’s data points out that the percentage of pedestrian related fatalities has stayed the same since the previous year. It also shows that motorcycle fatalities have significantly increased by 14.3% from 2015 to 2016.
What Are The Causes of Car Crashes in Salt Lake City?
With our dashboard we we’re able to narrow our data range to focus on the fatalities that occurred in Salt Lake City and find out what were the top contributing factors that caused these deadly crashes.
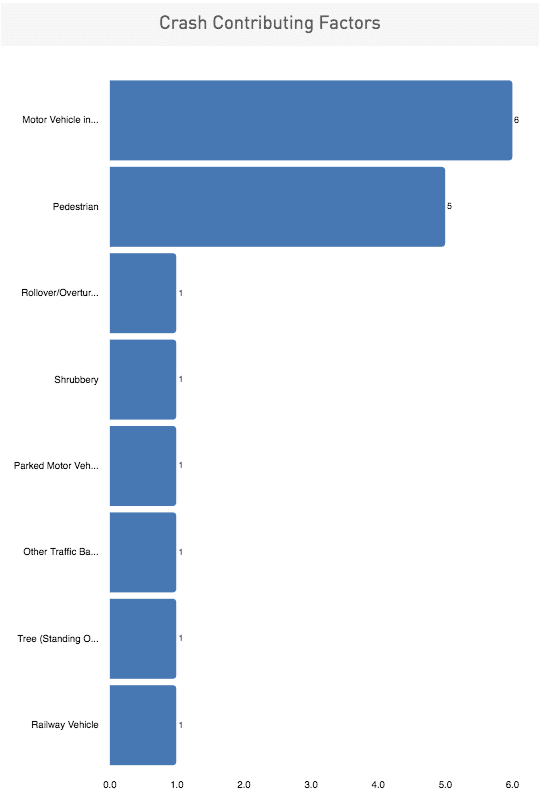
In 2016, Salt Lake City recorded 17 fatal car crashes, a 6% increase from the previous year. Looking at the chart of contributing factors, we see that the majority of these crashes were caused by another vehicle in transport. The 2nd most contributing factor were pedestrians.
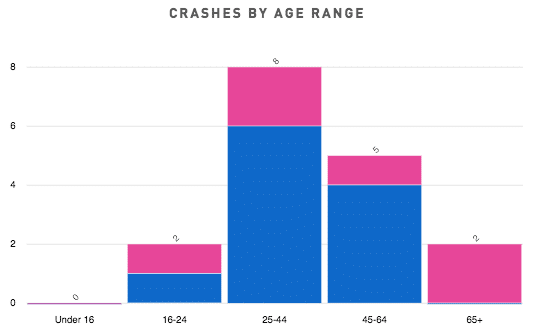
What is the Most Common Age & Gender for Car Accident Fatalities?
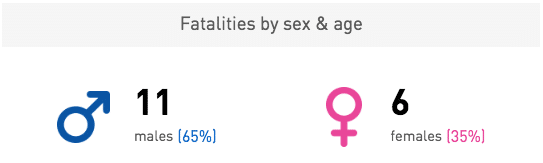
65% of reported crash victims were males around the ages of 25-44 and 45-64.
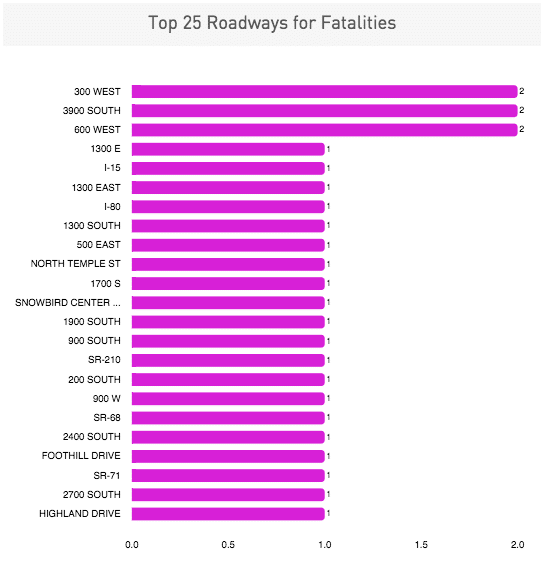
What Are The Most Dangerous Roads in Salt Lake City?
When we view Utah’s top 25 roadways, three roads tie for the most fatalities in the proximity of Salt Lake City. 300 West, 3900 South and 600 West we’re the roadways that experienced multiple fatalities in one year.
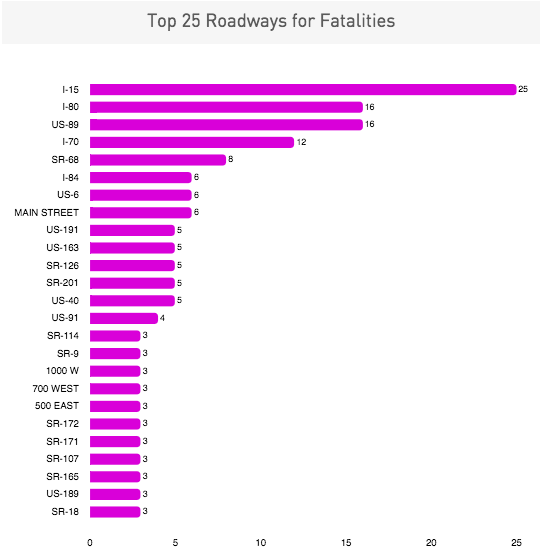
If we look outside of Salt Lake City, our Top 25 Roadways for Fatalities chart shows that the Interstate 15, one of Utah’s busiest freeways, was a significant contributor with 25 fatal accidents for the entire state.
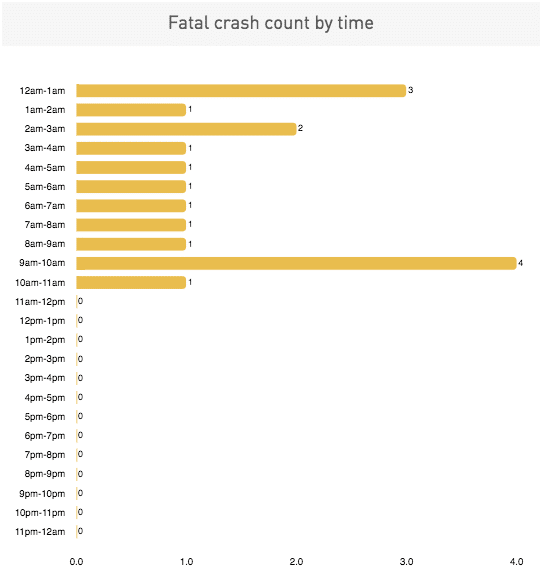
What is The Most Dangerous Time to Drive in Salt Lake City?
Surprisingly, the hour between 9am – 10am had the most crashes, when compared to the later hours where a lot of drivers are more likely to drive under the influence. 12am to 1am was the second most dangerous time. All following hours between 12am and 10am had at least one traffic fatality.
The Salt Lake City car accident lawyer at Feller & Wendt, LLC™ provide this data to help educate drivers and make the roads of Salt Lake City a safer place. If you or a loved one were involved in a serious automobile crash, we can help you every step of the way. Contact our law firm today to get started with your free case review. Click here to learn more about Utah injury and death statistics.